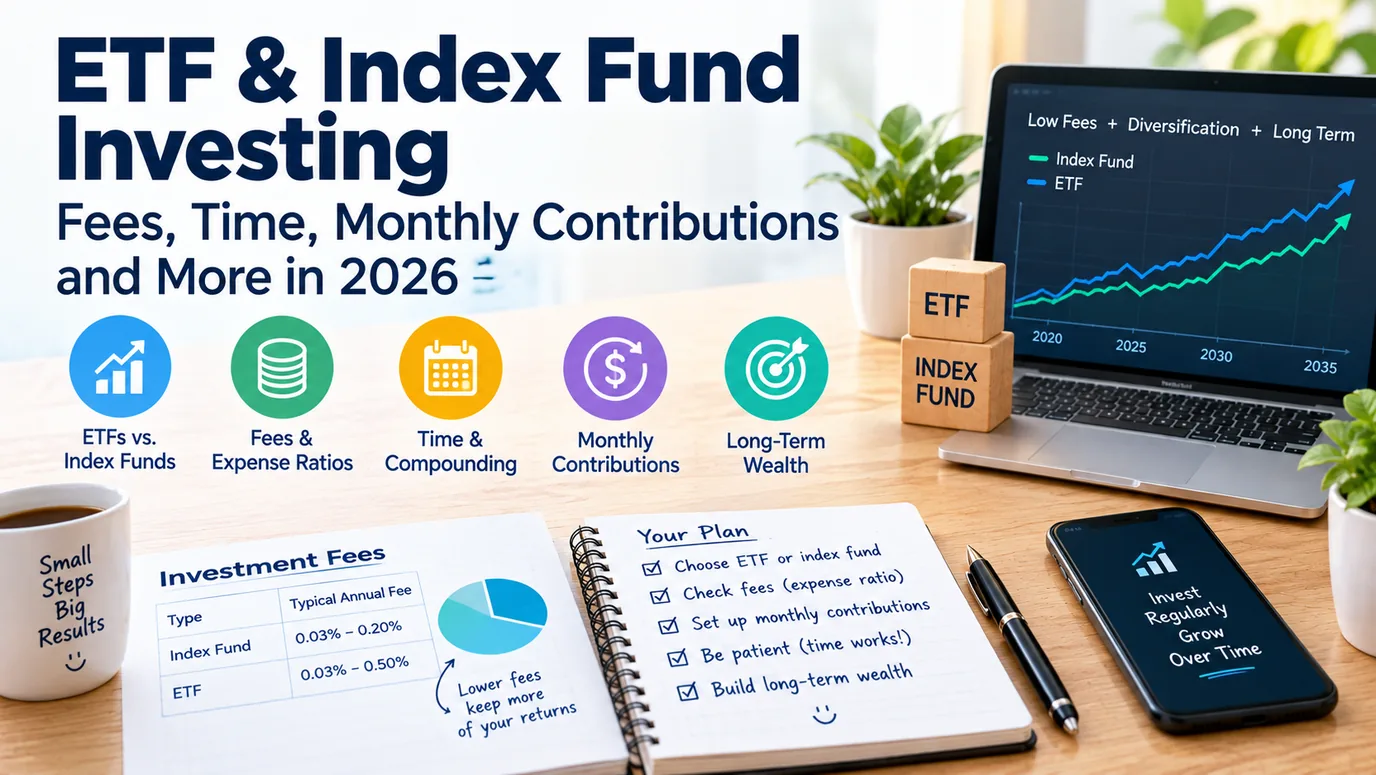
ETF or Index Fund: What Is the Difference?
An index fund holds the stocks or bonds in a market index, such as the S&P 500, in the same proportions, instead of a manager picking investments. An ETF (exchange-traded fund) is a fund that trades on a stock exchange like a share. Many ETFs track indexes, and many mutual funds do too, so "index ETF" and "index mutual fund" are close cousins.
| Feature | Index ETF | Index Mutual Fund |
|---|---|---|
| How it trades | Throughout the day, at market price | Once a day, at the closing value |
| Minimum to start | The price of one share (some brokers allow fractional shares) | Often a minimum, sometimes $1,000 or more |
| Automatic monthly investing | Depends on the broker | Usually easy to set up |
| Tax efficiency in a taxable account | Often slightly better | Can distribute more capital gains |
| Yearly cost (expense ratio) | Often very low for broad index funds | Often very low for broad index funds |
Swipe sideways to see all columns. For most long-term investors the two are close in practice. The bigger decisions are the fund's expense ratio, what it tracks and whether you keep investing regularly.
👉 Project your own investment with our free ETF and index fund calculator →
The Baseline Scenario
All the figures in this guide use: $10,000 to start, $500 a month (deposited at the end of each month), an assumed 7% yearly return before fees, a 0.05% expense ratio unless noted, and 2.5% inflation to show the value in today's dollars. Taxes, commissions and the cost of buying and selling are not included. The 7% is an illustration: real returns change every year and can be negative for long stretches.
Fees: The One Cost You Control
The expense ratio is the percentage of your balance the fund charges each year. It is deducted from the fund's return, so you never see a bill. After 30 years in the baseline scenario:
| Expense Ratio | Return After Fees | Balance After 30 Years | Lost to Fees vs. a 0% Fund |
|---|---|---|---|
| 0.03% | 6.97% | $656,989 | $3,860 |
| 0.05% | 6.95% | $654,429 | $6,419 |
| 0.20% | 6.80% | $635,580 | $25,269 |
| 0.50% | 6.50% | $599,657 | $61,192 |
| 0.75% | 6.25% | $571,438 | $89,411 |
| 1.00% | 6.00% | $544,691 | $116,157 |
Moving from a 1.00% fund to a 0.03% fund adds $112,297 to the final balance, on the same contributions and the same market return. A difference of less than one percentage point a year compounds into six figures, because fees are charged on a balance that grows every year.
Where to find it: the fund's prospectus has a standard fee table with the expense ratio, as required by the SEC.
Time: The Longer, the Bigger the Share That Is Growth
Baseline scenario with a 0.05% fee:
| Years | Balance | You Contributed | Growth | Value in Today's Dollars |
|---|---|---|---|---|
| 10 | $104,885 | $70,000 | $34,885 | $81,936 |
| 20 | $290,669 | $130,000 | $160,669 | $177,387 |
| 30 | $654,429 | $190,000 | $464,429 | $311,994 |
| 40 | $1,366,664 | $250,000 | $1,116,664 | $508,988 |
After 10 years about a third of the balance is growth; after 40 years it is more than 80%. Notice also the last column: after 30 years, $654,429 is worth about $312,000 in today's dollars at 2.5% inflation. Plan for what the money will buy, not only the number. For the full story on compounding and starting early, read our guide on compound interest.
Contributions: How Much You Add Matters More Than Fine-Tuning the Return
Starting from zero, 30 years, 7% return, 0.05% fee:
| Monthly Contribution | You Contribute | Balance After 30 Years |
|---|---|---|
| $200 | $72,000 | $231,747 |
| $1,000 | $360,000 | $1,158,734 |
The balance rises in step with the amount: five times the deposit gives five times the result. You can also raise your contribution every year with your income. In the baseline scenario, adding 3% more each year to your $500 deposit turns $654,429 into $870,833, with total contributions of $295,452.
The Return You Assume Changes Everything
Same baseline, with different assumed yearly returns before the 0.05% fee:
| Assumed Return | Balance After 30 Years | Value in Today's Dollars |
|---|---|---|
| 5% | $446,722 | $212,971 |
| 7% | $654,429 | $311,994 |
| 10% | $1,193,622 | $569,051 |
Broad U.S. stock funds have averaged roughly 10% a year before inflation over very long periods, with large drops along the way, and there is no guarantee the future will match the past. A cautious plan might use 5% to 7%, and a plan that depends on 10% has no margin for error. Test several values in the calculator.
Dollar-Cost Averaging: Investing the Same Amount Each Month
Putting in a fixed amount at regular intervals is called dollar-cost averaging. When prices are low, your money buys more shares; when prices are high, it buys fewer. It does not guarantee a profit or protect against losses, but it has two practical benefits: it removes the pressure to guess the right time to invest, and it turns investing into a habit tied to your paycheck. If you already hold a lump sum, investing it all at once has historically done better more often than spreading it out, but spreading it out can be easier to stick with.
What to Look For in an Index Fund or ETF
- A low expense ratio. For broad market index funds, very low is common.
- A broad index. A total market or large-company index spreads your money over hundreds or thousands of companies, which reduces the damage if one fails.
- What it holds. Check the index, the number of holdings and the largest positions.
- Size and trading volume for ETFs, so buying and selling is easy and the price stays close to the value of the holdings.
- Tracking. A good index fund follows its index closely.
- The account type. In a taxable account, dividends and gains are taxed; a retirement account such as an IRA or a 401(k) shelters them. Our guide on Roth IRA vs. 401(k) explains how to order your accounts.
Common Mistakes
- Chasing last year's best performer. Past returns do not predict future ones.
- Ignoring fees because they look small.
- Stopping contributions during a market drop, which is when each dollar buys the most shares.
- Investing money you need within a few years. Short-term goals belong in savings; see our guide on saving each month for a goal.
- Forgetting taxes and inflation when estimating what your balance is really worth.
Frequently Asked Questions
Is an ETF better than an index fund?
Neither is better in general. They can track the same index at similar cost. ETFs trade all day and can be more tax-efficient in a taxable account; index mutual funds make automatic investing easy. Choose based on your broker, your account and the fund's cost.
How much should I invest each month?
A common target for retirement is around 10% to 15% of your income, including any employer match. The calculator shows what different monthly amounts could become over your time horizon.
Can I lose money in an index fund?
Yes. Index funds rise and fall with the market and can lose a large share of their value in a downturn. Historically markets have recovered over long periods, but that is not guaranteed, which is why the time horizon matters.
What is a good expense ratio?
Lower is better for the same index. Broad index ETFs and funds often charge a few hundredths of a percent to a few tenths, while actively managed funds often charge several times more.
Does this calculator include taxes?
No. It shows growth before taxes on dividends and gains, which depend on your account type and tax bracket.
Conclusion & Recommended Next Steps
The three levers you control are how much you invest, how long you stay invested and what you pay in fees. The market return is out of your hands. Run your own starting amount, monthly contribution and time horizon in the calculator, compare a low-fee fund with a higher-fee one, and check the result in today's dollars.
ETF & Index Fund Calculator
Project growth with fund fees and inflation.
Compound Interest Calculator
See the effect of time and regular deposits.
401(k) & Roth IRA Calculator
Compare tax-advantaged retirement accounts.
FIRE Retirement Calculator
See how much you need to retire early.
Disclaimer: This guide is intended solely for educational and informational purposes and does not constitute personalized financial, investment, legal, or tax advice. Investing involves risk, including the loss of principal, and past performance does not guarantee future results. The figures above are illustrations based on the stated assumptions; they do not reflect any specific fund. Read a fund's prospectus and consult a qualified financial professional before you invest.