What ROI Measures
Return on investment (ROI) is the profit from an investment as a percentage of what it cost you. It works for almost anything: a stock, a rental property, a piece of equipment, a marketing campaign or a course. It answers a simple question: for every dollar I put in, how many dollars of profit did I get?
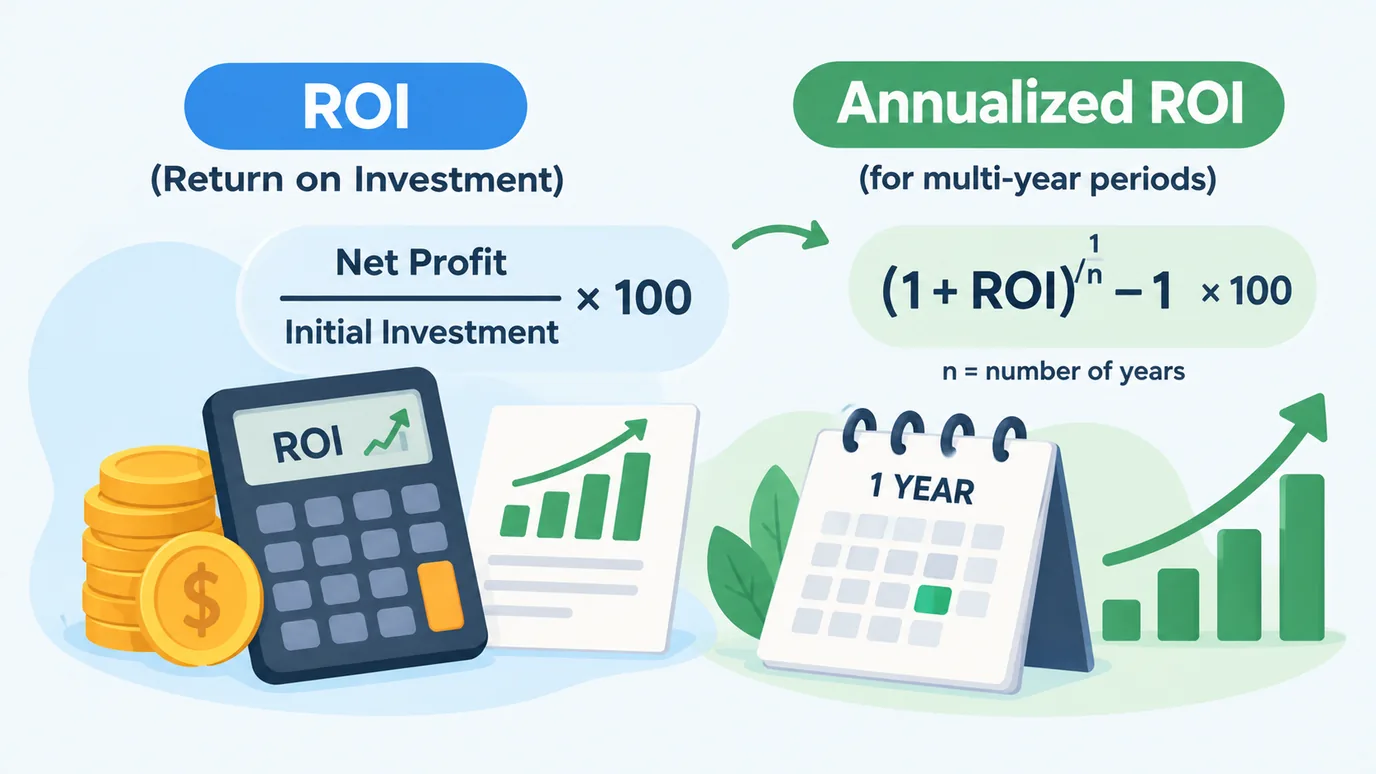
ROI = net profit ÷ total cost × 100, where net profit = final value − total cost, and total cost includes the amount invested plus any extra costs, such as fees, repairs or taxes.
👉 Calculate your own ROI and annualized return with our free ROI calculator →
A Worked Example
You buy something for $10,000, pay $500 in fees and repairs, and later it is worth $15,000:
| Step | Amount |
|---|---|
| Amount invested | $10,000 |
| Extra costs | $500 |
| Total cost | $10,500 |
| Final value | $15,000 |
| Net profit | $4,500 |
| ROI | 42.86% |
| Multiple on the money invested | 1.43x |
Hidden Costs Quietly Shrink ROI
Leaving out costs makes an investment look better than it is. With the same $10,000 that ends at $15,000:
| Extra Costs | Total Cost | Net Profit | ROI |
|---|---|---|---|
| $0 | $10,000 | $5,000 | 50.00% |
| $500 | $10,500 | $4,500 | 42.86% |
| $1,500 | $11,500 | $3,500 | 30.43% |
| $2,000 (and a final value of $12,000) | $12,000 | $0 | 0.00% |
Swipe sideways to see all columns. A $1,500 cost takes the ROI from 50% to 30.4%, a loss of almost 20 points. The last row shows a gain of $2,000 that is entirely consumed by $2,000 of costs: a profit on paper, a zero return in reality. Typical hidden costs are brokerage and transaction fees, maintenance, taxes, insurance, interest on borrowed money and your own time.
The Problem With Plain ROI: It Ignores Time
Imagine two investments that both have a 42.86% ROI. One took one year to get there and the other took ten. They are not equal. The annualized return (also called CAGR, compound annual growth rate) converts the total return into a yearly rate:
Annualized return = (final value ÷ total cost)^(1 ÷ years) − 1
For the example above, the same $4,500 profit on $10,500 of cost, with different holding periods:
| Holding Period | ROI | Annualized Return |
|---|---|---|
| 1 year | 42.86% | 42.86% |
| 3 years | 42.86% | 12.62% |
| 5 years | 42.86% | 7.39% |
| 10 years | 42.86% | 3.63% |
The ROI never changes, but the yearly return falls from 42.9% to 3.6%. And doubling your money is not always impressive: a 100% ROI over 10 years is only 7.18% a year.
Comparing ROI With Other Options
ROI only means something against an alternative. If you could put the same $10,000 in a diversified index fund earning an assumed 7% a year, it would grow to about $19,672 in 10 years, a 96.7% return. An investment with a 42.86% ROI over 10 years would have done worse than that alternative, even though 42.86% sounds good by itself. This idea is called opportunity cost: the return you gave up by choosing something else. See our ETF and index fund calculator to estimate the alternative.
When ROI Is Negative
ROI can be below zero. Investing $10,000 with $500 of costs and ending with only $9,000 after two years gives:
- Net loss: $1,500
- ROI: −14.29%
- Annualized return: −7.42%
- Multiple on the money: 0.86x
Negative returns are also harder to recover from than they look: after a 14% loss you need a 16.7% gain just to get back to even.
What ROI Does Not Tell You
- Risk. Two investments with the same ROI can have very different chances of losing money.
- Timing of the cash flows. If money goes in and out at different times, you need a measure like NPV or IRR. Our guide on NPV and IRR covers this.
- Inflation. A 4% return in a year with 3% inflation is a much smaller real gain. Check it with our inflation calculator.
- Taxes. Profits are often taxed, which lowers your after-tax ROI.
- Non-financial value. A training course, a safer car or a better tool may pay back in ways ROI does not capture.
ROI for a Business or Marketing Decision
ROI works for business choices too: a new machine, a website or an ad campaign. For advertising, there is a related measure called ROAS that compares revenue with ad spend, and it behaves differently from ROI because it ignores your product costs. Read our guide on ROAS vs. ROI before you judge a campaign by revenue alone.
Seven Tips for Calculating ROI Honestly
- Include every cost, not only the purchase price.
- Use the same time period when you compare options, or annualize them.
- Use realistic final values, not best-case ones.
- Count the cost of borrowing if you used a loan.
- Compare with an alternative, such as an index fund or paying down debt.
- Consider taxes on the profit.
- Look at the risk, not only the return.
Frequently Asked Questions
How do you calculate ROI?
Subtract the total cost from the final value to get net profit, divide by the total cost and multiply by 100. The total cost includes the amount invested and all extra costs.
What is a good ROI?
It depends on the type of investment, the time period and the risk. Compare the annualized return with what you could earn elsewhere with similar risk, rather than aiming for a fixed number.
What is the difference between ROI and annualized ROI?
ROI is the total return over the whole period. The annualized return expresses it as a yearly rate, which lets you compare investments held for different lengths of time.
Can ROI be negative?
Yes. If the final value is less than the total cost, you have a loss and a negative ROI.
Is ROI the same as profit margin?
No. ROI compares profit with the cost of the investment, while profit margin compares profit with the revenue of a sale. See our guide on profit margin vs. markup.
Conclusion & Recommended Next Steps
ROI is a quick way to compare what you got with what you spent, but only if every cost is counted and the time period is taken into account. Calculate the plain ROI, then the annualized return, and then compare both with your next best alternative. Put your own amounts in the calculator and test how extra costs or a longer holding period change the answer.
ROI Calculator
Find your ROI, net profit and annualized return.
NPV & IRR Calculator
Evaluate investments with cash flows over several years.
ETF & Index Fund Calculator
Estimate the return you would give up.
Inflation Calculator
See your return in today's dollars.
Disclaimer: This guide is intended solely for educational and informational purposes and does not constitute personalized financial, investment, legal, or tax advice. Investment returns are not guaranteed and the figures above are illustrations based on the stated assumptions. Consult a qualified financial professional before you invest.